Map visualization#
In this section, you will find information related to map visualization. In the first section you will learn how to set the styles to a GEE image fully compatible with both SEPAL and pysepal, and in the last section, you will find the info about the default and custom styles that can be applied to pysepal.mapping.SepalMap.
Set EE Image visualization#
In the current release of SEPAL, Custom assets can be displayed in the main interface to overlay different information in the same place.
As the main goal of this library is to create assets in the the SEPAL framework and as pysepal is bound to GEE for many modules, we will present you here the different way of creating an Image asset that can be automatically displayed in SEPAL and remain consistent with what you display in your app.
Create a visualization#
To create an ee.Image compatible with the visualization tool of SEPAL, add extra-properties to the ee.Image using the set method:
import ee

image # an ee.Image created by previous scripts

ee_image.set({
    "visualization_0_name": "Classification",
    "visualization_0_bands": "red,blue,green",
    "visualization_0_type": "rgb",
    "visualization_0_min": "0",
    "visualization_0_max": "2000"
})
To create visualization parameter, property have been add as a json dictionary to the image.
Note
You can set as many visualization in the dictionary as you want. Each one will be differentiated by it’s ID number and interpreted separately by the SEPAL interface.
Each key of this dictionary should start with visualisation_<number>_<keyword>: <value> with:
number: the visualization ID numberkeyword: the keyword to specify the visualization property you want to setvalue: the value of the property set as a string. if multiple value need to be set (e.gbands) they need to be split using comas in the same string.
Note
In the next parts only the keywords will be specified.
To reproduce our example you can check the following asset: users/wiell/forum/visualization_example
Visualization types#
RGB false colors#
This is setting a 3 bands false color visualization. Each band will be represented as red green and blue (respectively) on the final display. It is compulsory to set at least the type key to rgb. The other available keys are the following:
name: The name that will be displayed in the SEPAL interface.
bands: The 3 bands to display. Each one must correspond to an existing band in your image. It can be numbers or names.
gamma: Set the gamma of the image. It should be a float.
min: The minimal value to use in all bands or the minimal value to use in each band. Use comas to separate the different values.
max: The maximal value to use in all bands or the maximal value to use in each band. Use comas to separate the different values.
inverted: Boolean, whether or not the bands should be read inverted. Can also be set individually for each band using comas.
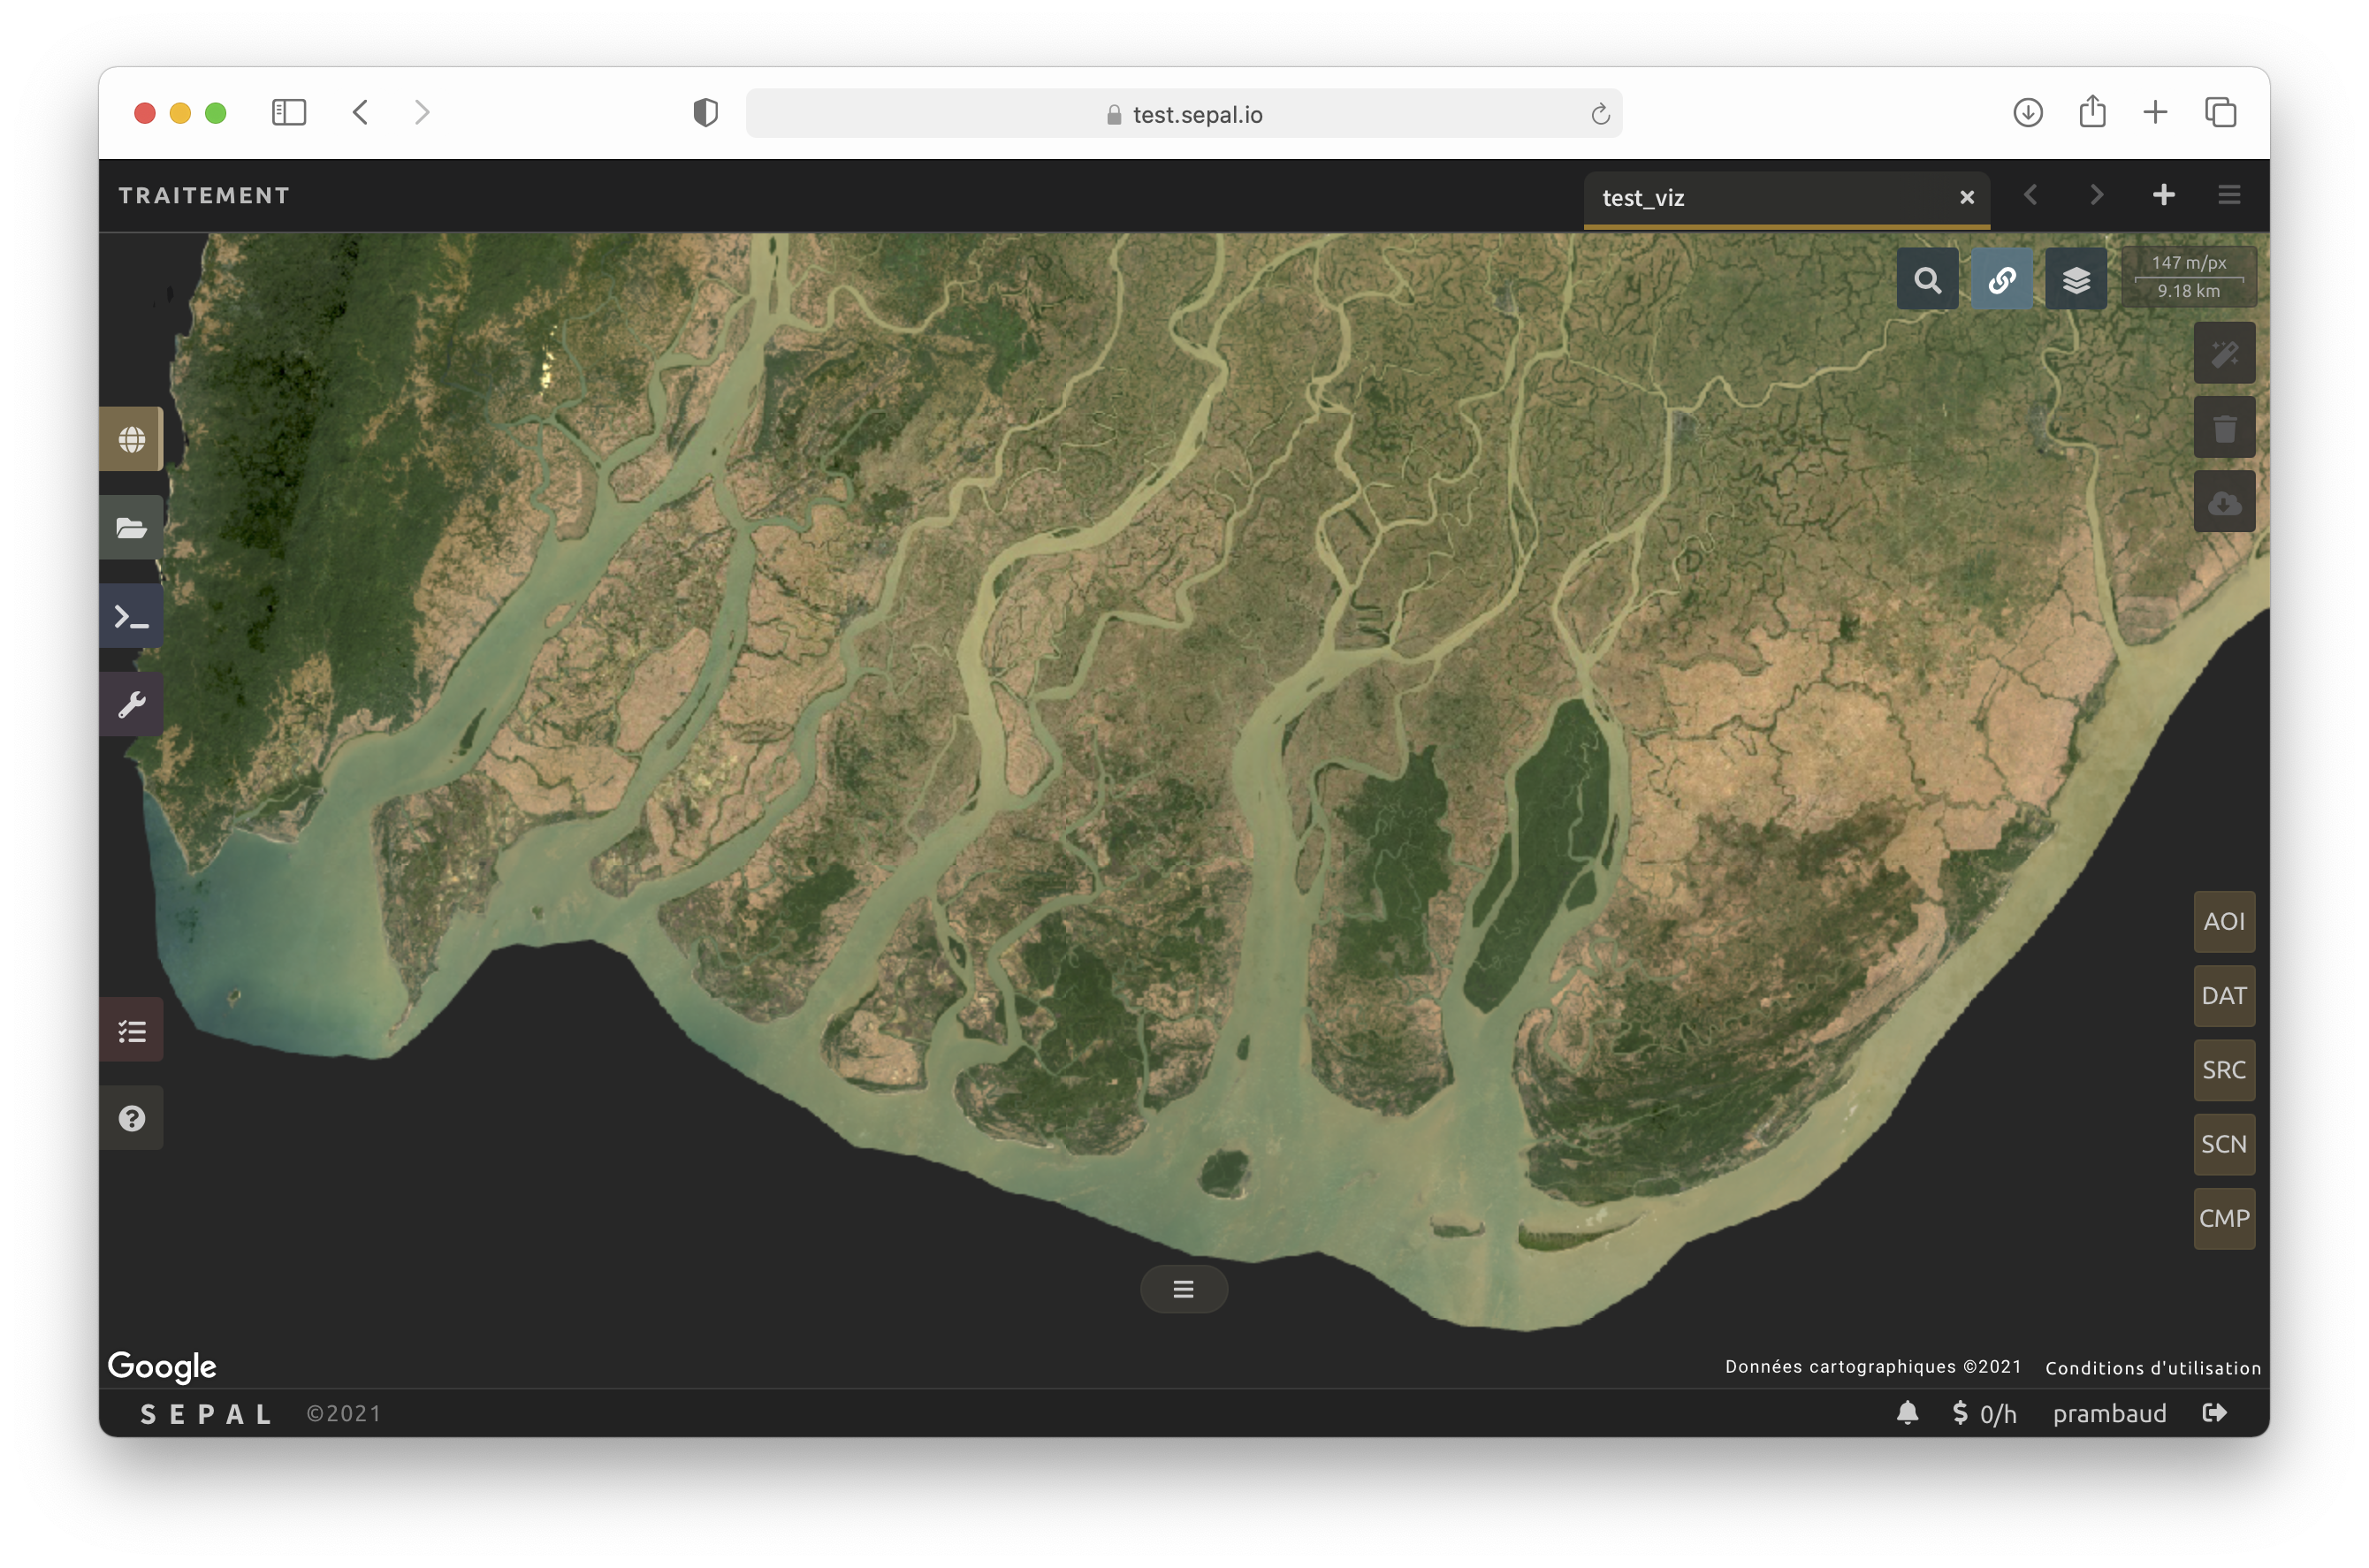
An example of Image property using the example asset:
{
    "visualization_0_type": "rgb",
    "visualization_0_name": "RGB",
    "visualization_0_bands": "red,green,blue",
    "visualization_0_gamma": "1.2",
    "visualization_0_min": "0",
    "visualization_0_max": "2000"
}
and the corresponding display:
HSV false colors#
This is setting 3 band false color visualization. Each band will be represented as Hue Saturation and Value (respectively) on the final display. It is compulsory to set at least the type key to hsv. The other available keys are the following:
name: The name that will be displayed in the SEPAL interface.
bands: The 3 bands to display. each one must correspond to an existing band in your image. It can be numbers or names.
min: The minimal value to use in all bands or the minimal value to use in each band. Use comas to separate the different values.
max: The maximal value to use in all bands or the maximal value to use in each band. Use comas to separate the different values.
inverted: Boolean, whether or not the bands should be read inverted. Can also be set individually for each band using comas.
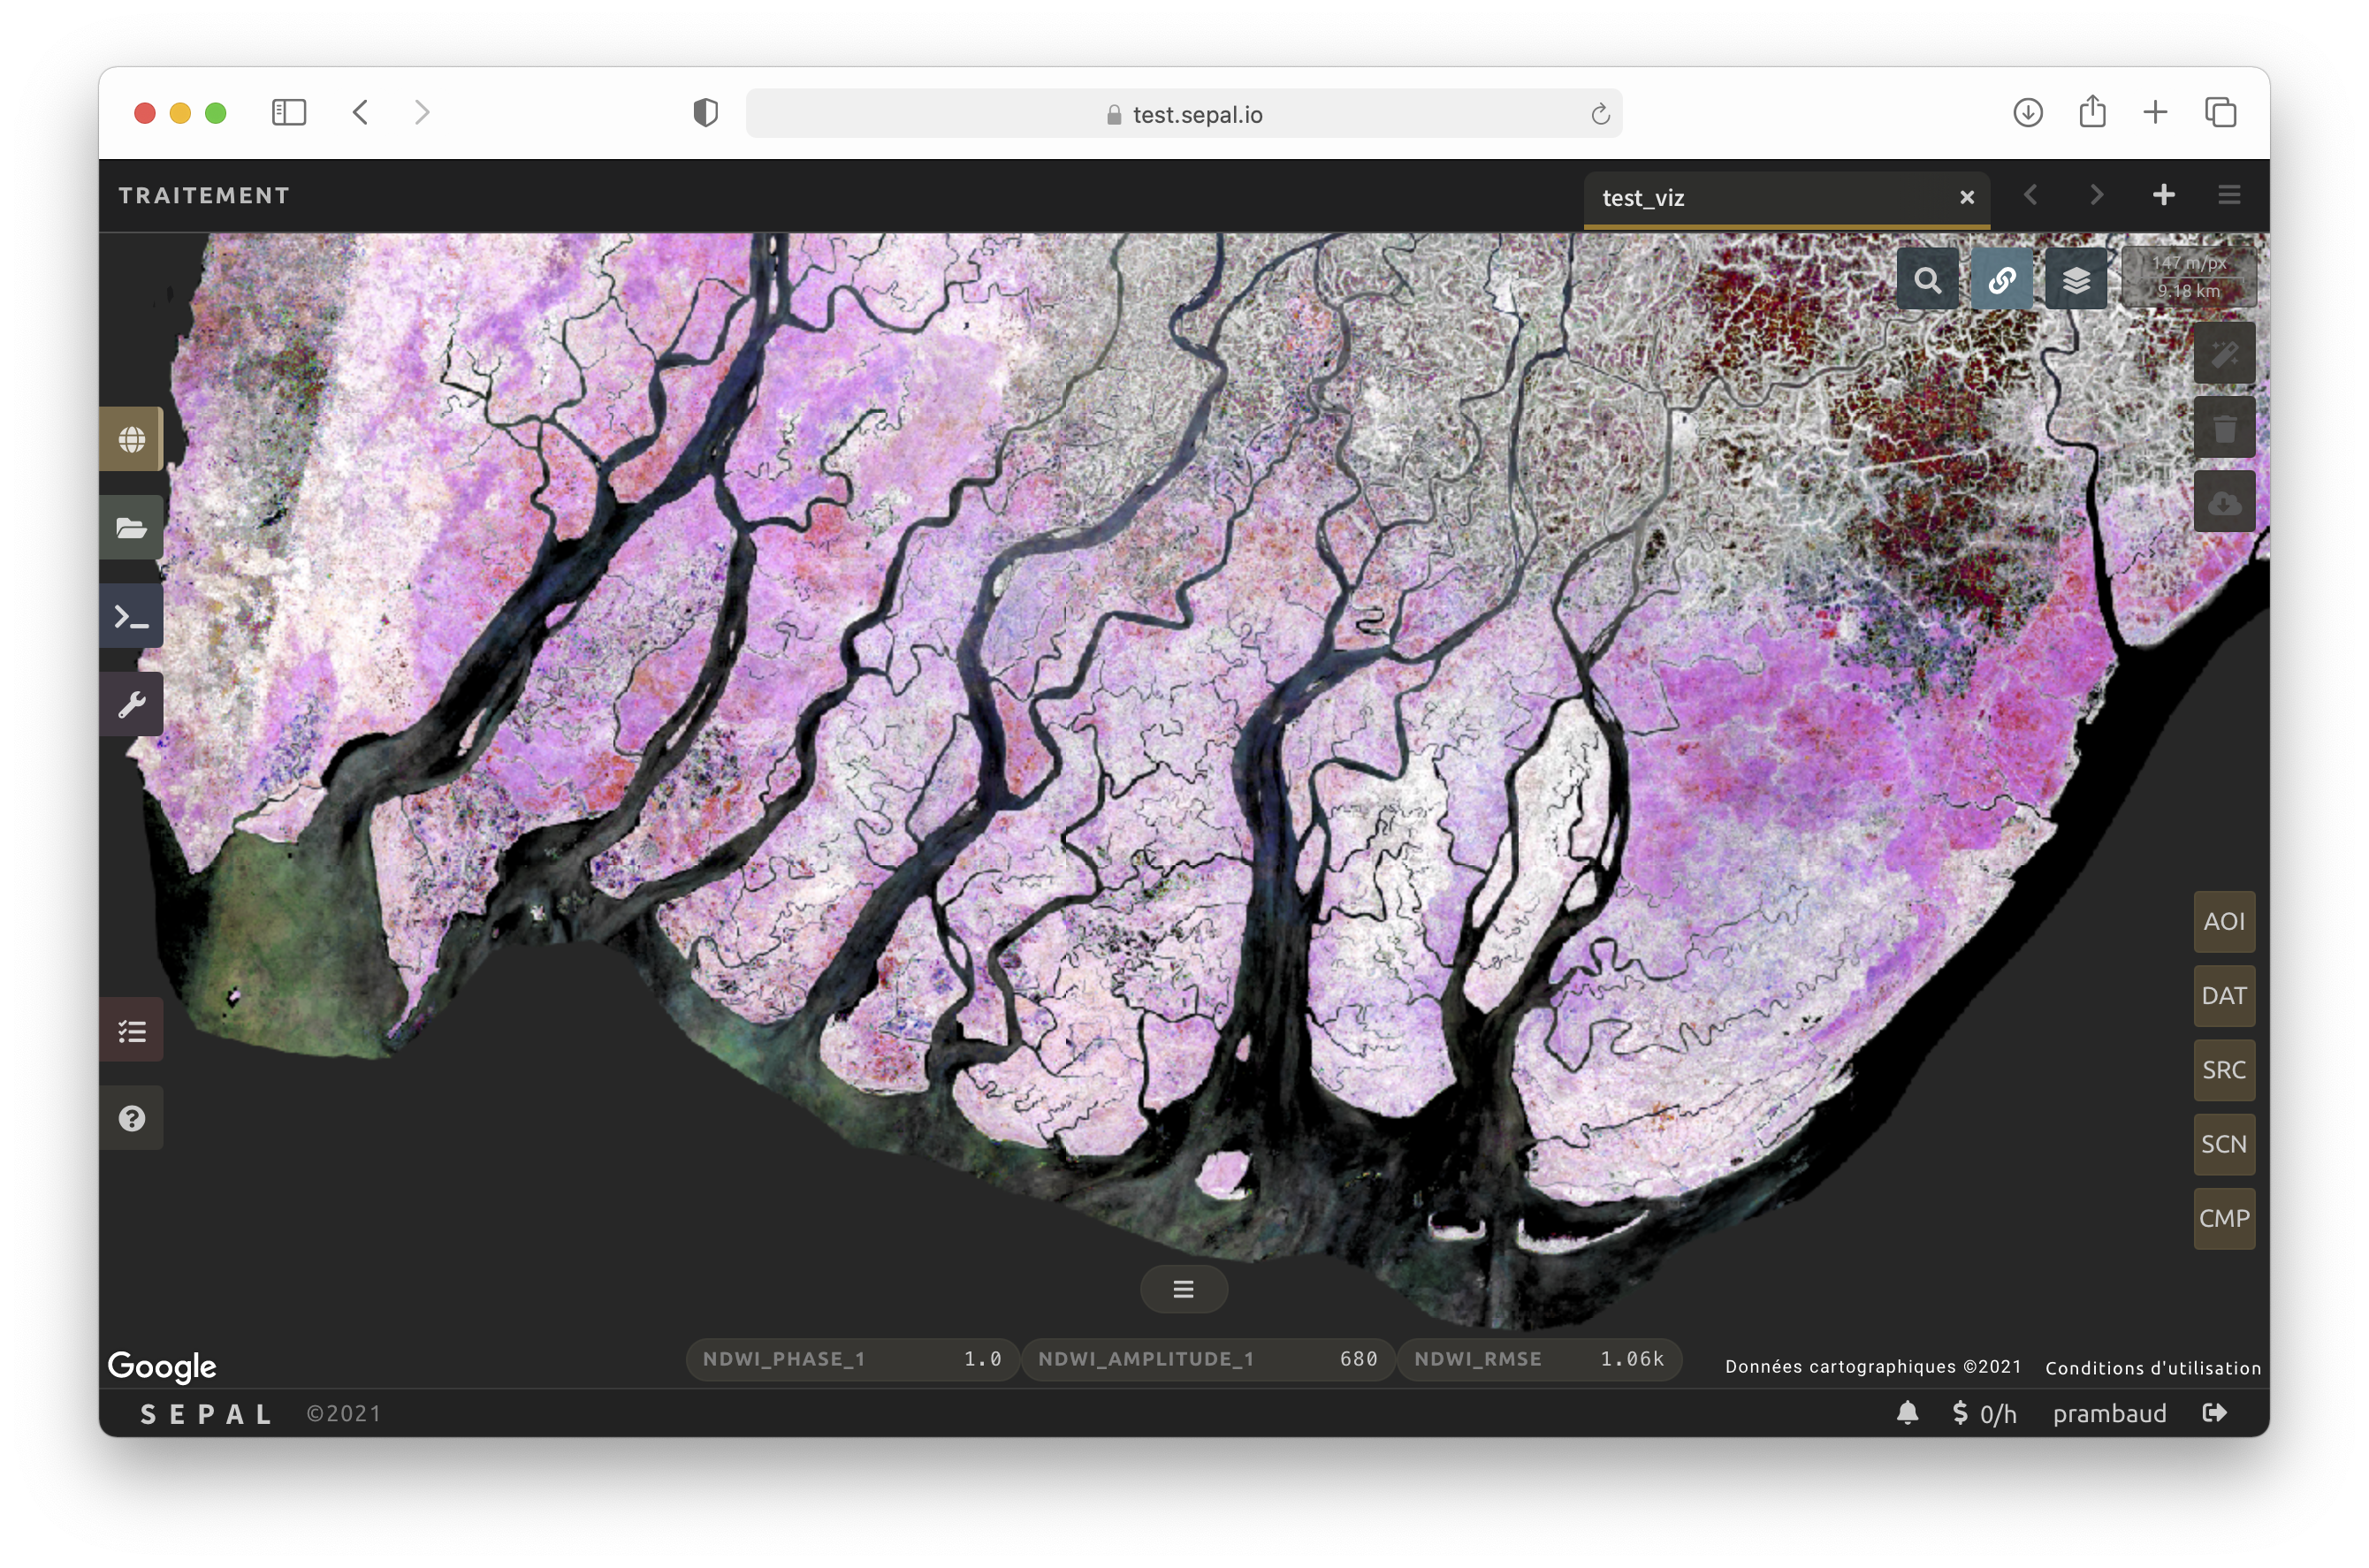
An example of Image property using the example asset:
{
    "visualization_0_type": "hsv",
    "visualization_0_name": "NDWI harmonics",
    "visualization_0_bands": "ndwi_phase_1,ndwi_amplitude_1,ndwi_rmse",
    "visualization_0_inverted": "false,false,true",
    "visualization_0_min": "-2.1875,352,320",
    "visualization_0_max": "2.40625,3296,1792"
}
and the corresponding display:
Single band continuous#
This is setting single band ramp color visualization. The band will be represented with the selected colormap on the final display. It is compulsory to set at least the type key to continuous. The other available keys are the following:
name: The name that will be displayed in the SEPAL interface.
bands: The band to display. It must correspond to an existing band in your image. It can be numbers or names.
min: The minimal value to use for the band.
max: the maximal value to use for the band.
palette: The colors to use in the ramp. They should be set as hex (e.g. #000000) values separated with comas.
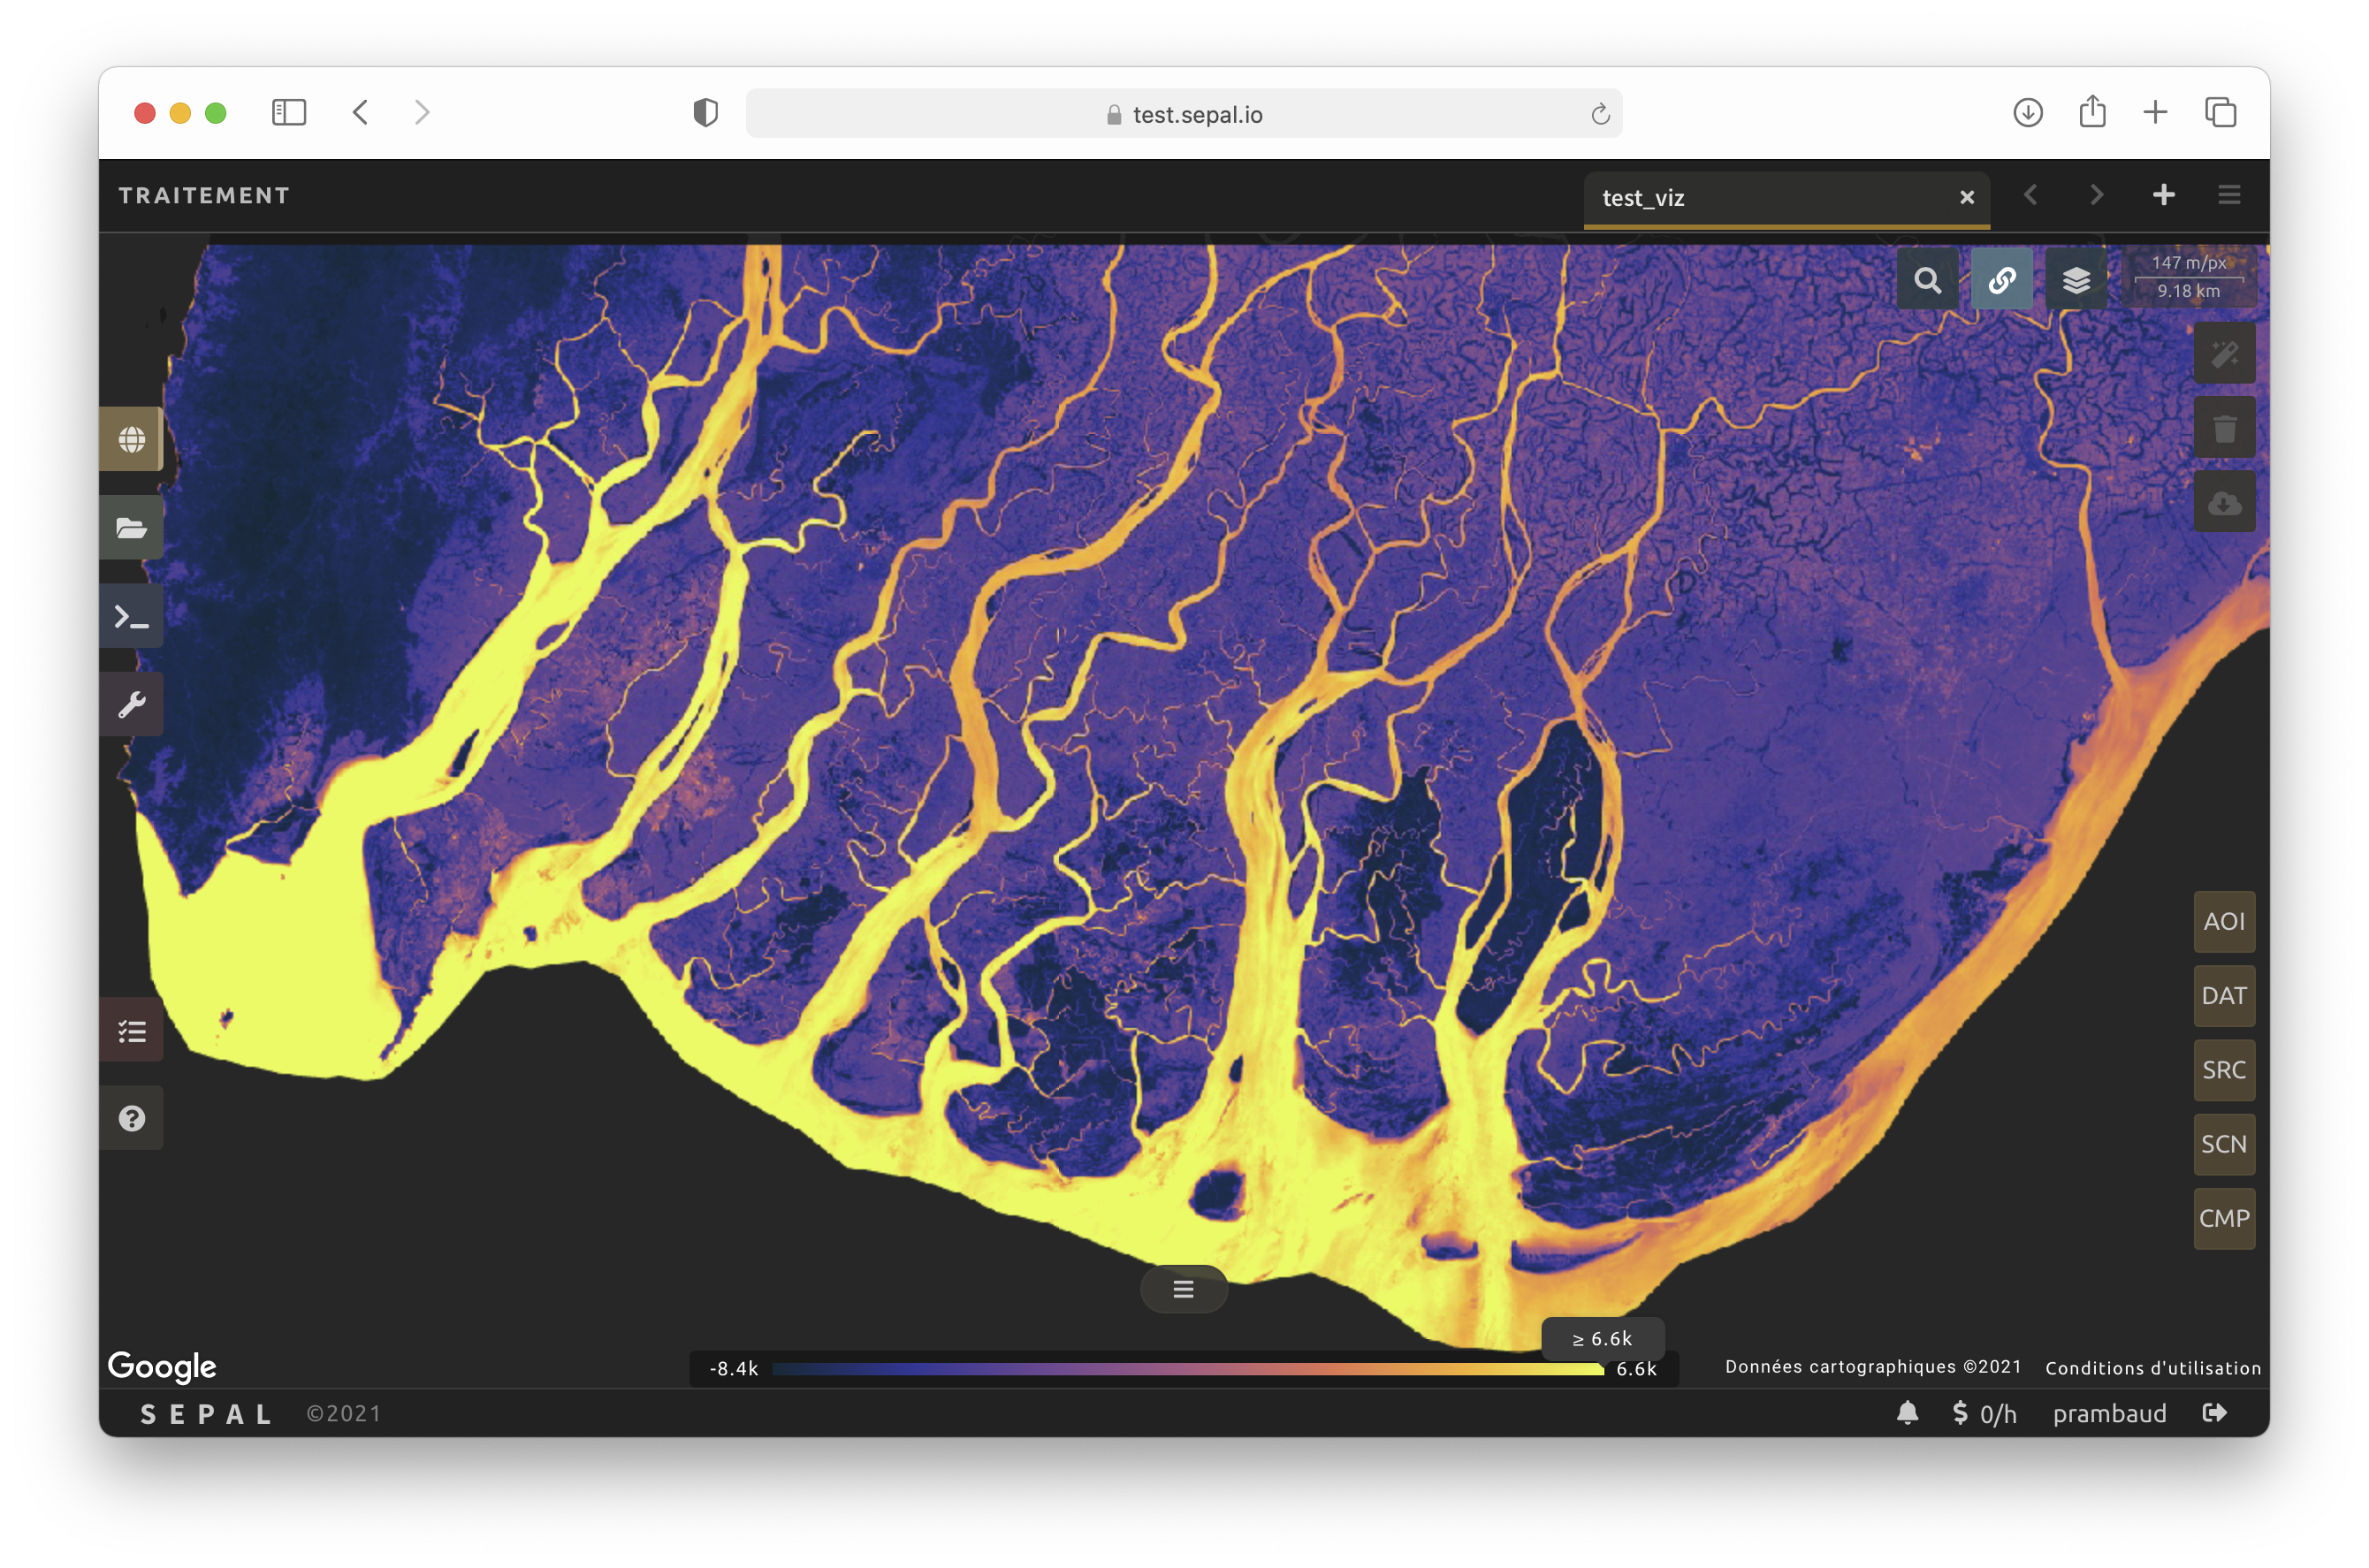
An example of Image property using the example asset:
{
    "visualization_0_type": "continuous",
    "visualization_0_name": "NDWI",
    "visualization_0_bands": "ndwi",
    "visualization_0_palette": "#042333,#2c3395,#744992,#b15f82,#eb7958",
    "visualization_0_max": "6610",
    "visualization_0_min": "-8450"
}
and the corresponding display:
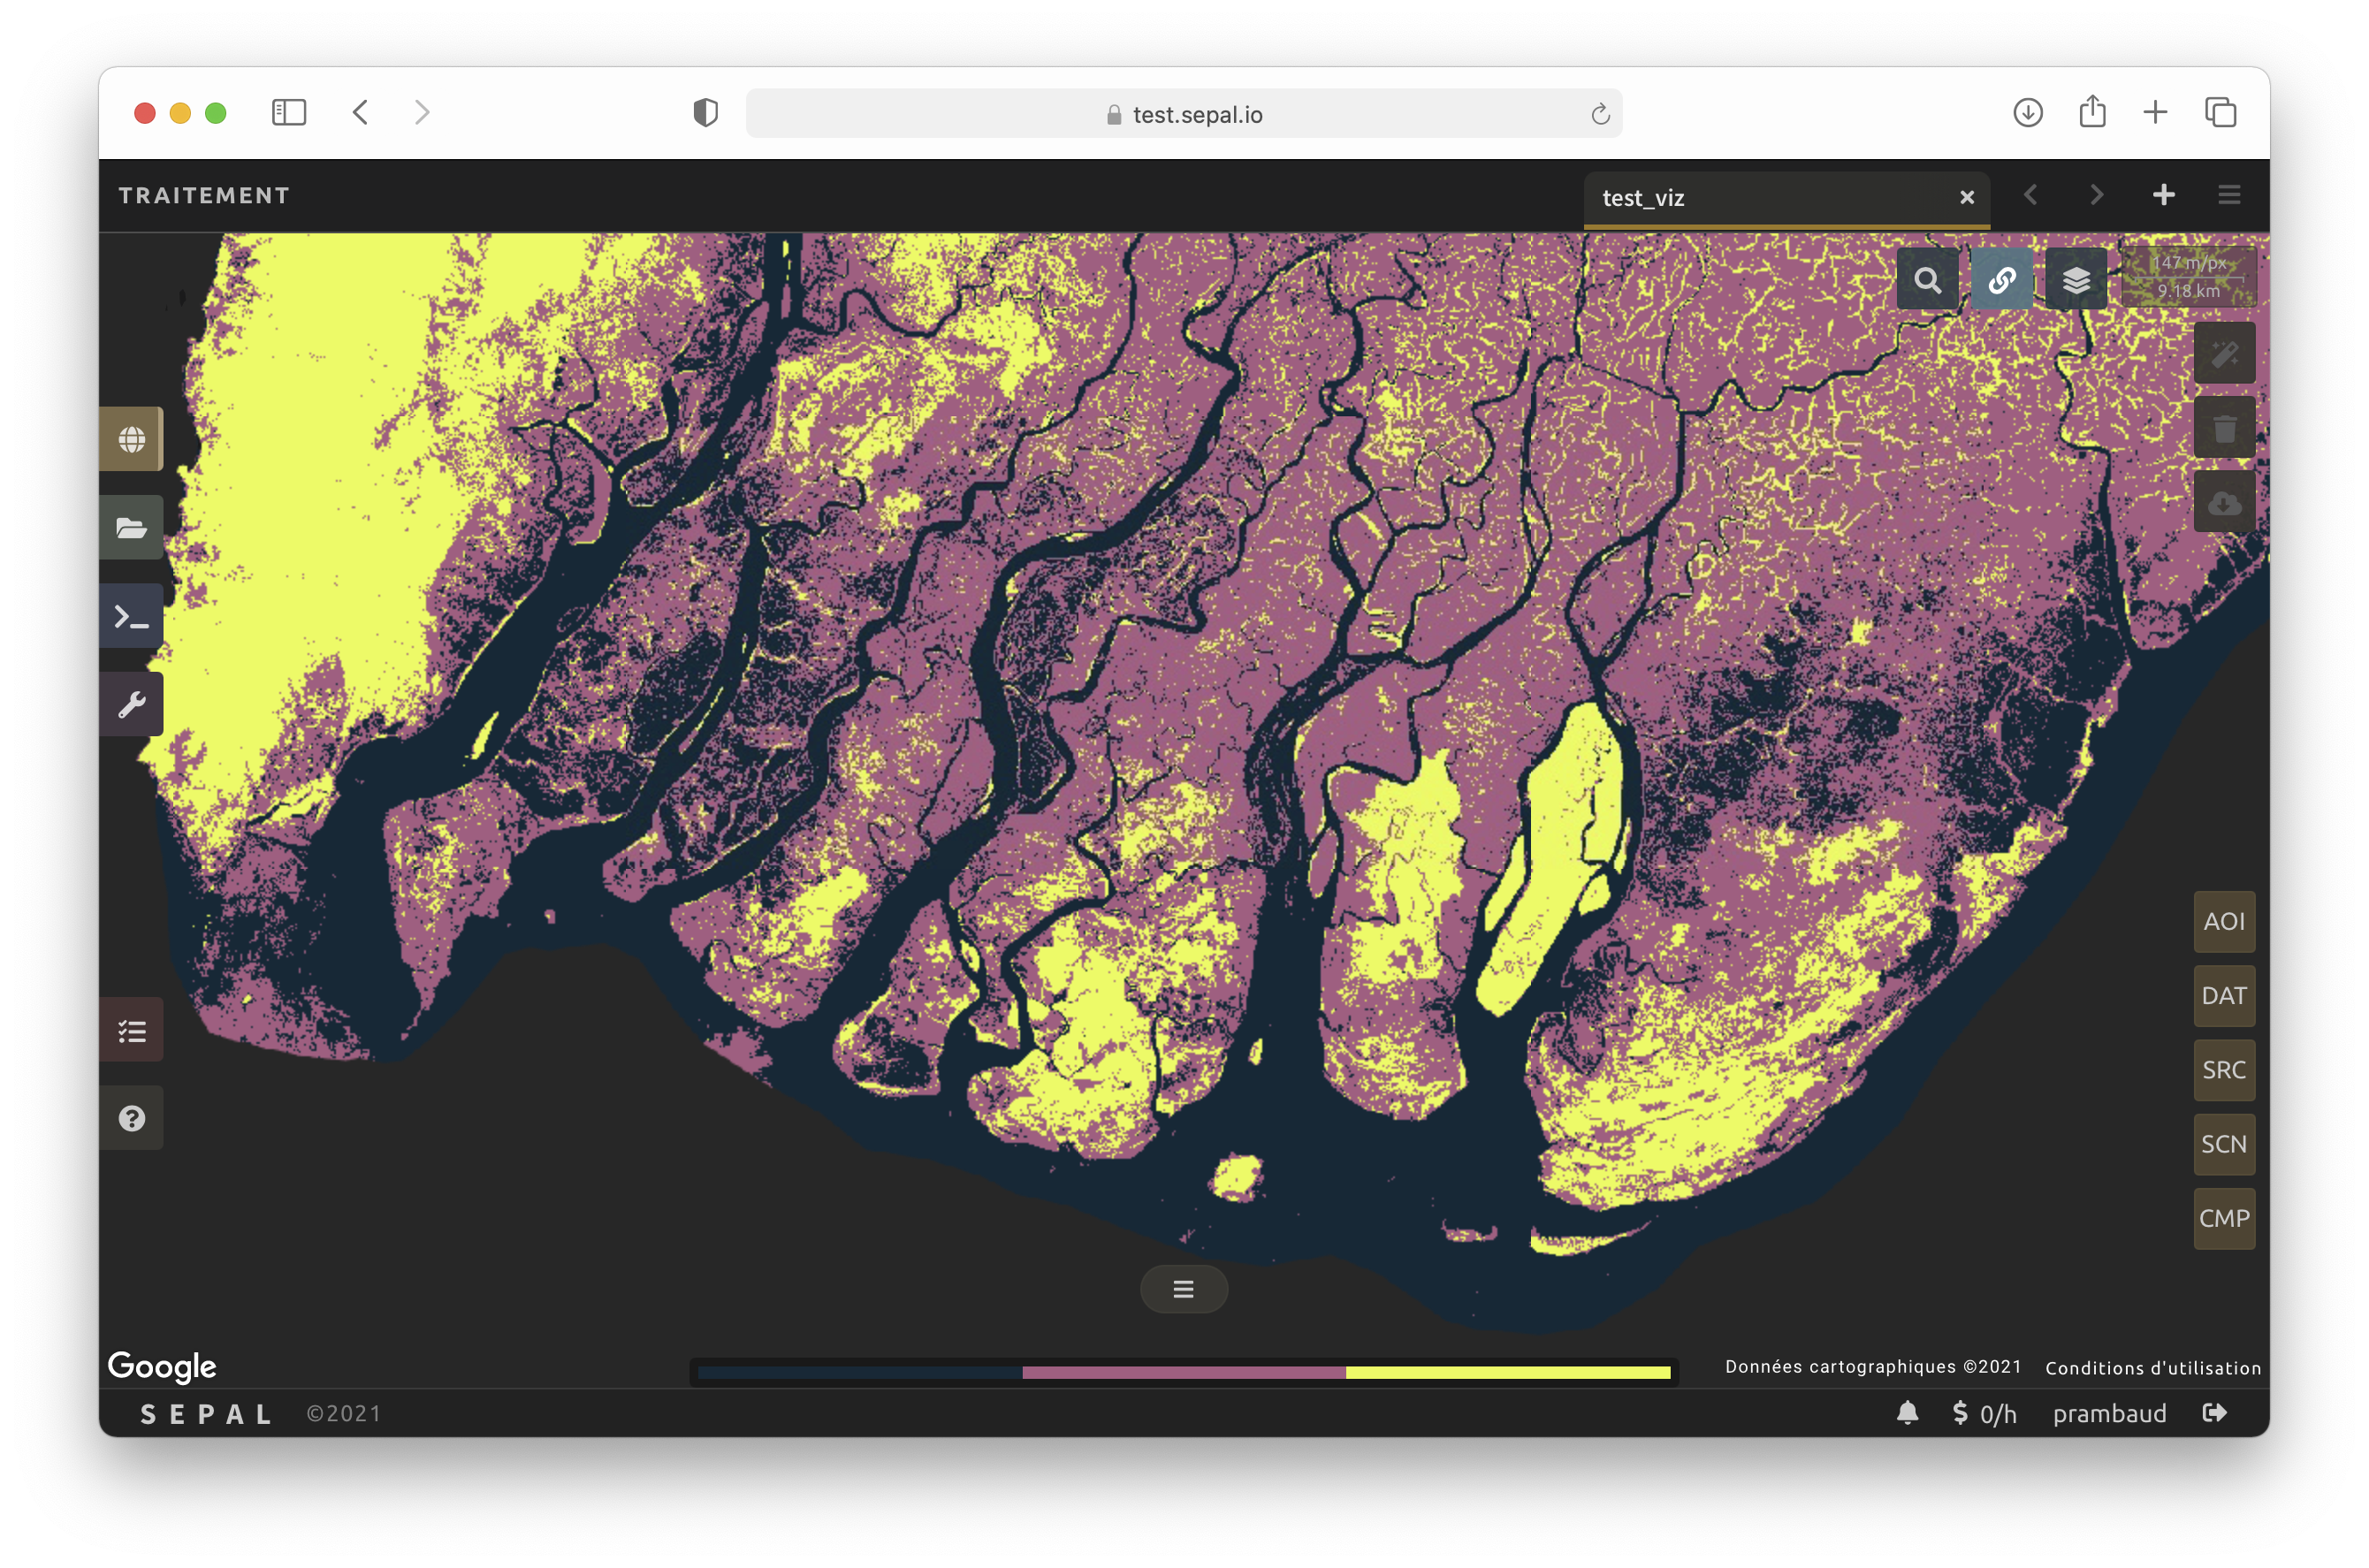
Single band categorical#
This is setting single band categorical visualization. The band will be represented with the selected colors for each value on the final display. It is compulsory to set at least the type key to categorical. The other available keys are the following:
name: the name that will be displayed in the SEPAL interface.
bands: the band to display. It must correspond to an existing band in your image. It can be numbers or names.
palette: The colors to use in the ramp. They should be set as hex values (e.g. #000000) separated with comas.
labels: The labels of each category. Use names separated with comas.
values: the values of each category. Use integer separated with comas.
An example of Image property using the example asset:
{
    "visualization_0_type": "categorical",
    "visualization_0_name": "CLASS",
    "visualization_0_bands": "class",
    "visualization_0_palette": "#042333,#b15f82,#e8fa5b",
    "visualization_0_labels": "Foo,Bar,Baz",
    "visualization_0_values": "5,200,1000"
}
and the corresponding display:
Set EE vector visualization#
By default, when adding a vector (ee.Geometry, ee.Feature, ee.FeatureCollection) layer to a SepalMap map, it will use pre-defined styles (features without fill color and primary color in the borders), which means, that if no visualization parameters (vis_params) are passed, it will use these.
The visualization parameters are added as a second argument in the SepalMap().add_layer(layer, vis_params) method, and it is receiving a dictionary. To check the available style parameters, please refer to the ee.FeatureCollection style documentation.
Note
By default, the fillColor property is set as transparent. If you’d like to use the same color as the border but with 50% of opacity, just set the value of the property as None, just as in the example below.
geometry = ee.FeatureCollection(
    ee.Geometry.Polygon(
        [
            [
                [-103.198046875, 36.866172202843465],
                [-103.198046875, 34.655531078083534],
                [-100.385546875, 34.655531078083534],
                [-100.385546875, 36.866172202843465],
            ]
        ],
    )
)

map_ = sm.SepalMap()
map_.addLayer(geometry, {"color": "red", "fillColor": None})